Small scale · Work package b and c
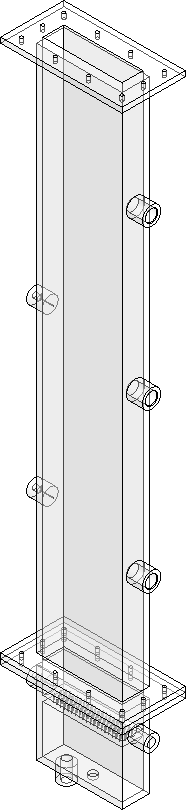
The Bubble Swarm Rig is a rectangular bubble column made of transparent plexiglass (150 × 40 mm cross-section, 1 m high). It supports the study of bubble swarms and their column-scale behaviour, as part of our goal of understanding the multiscale connection between small and large scales in multiphase flows.
The column is filled with the liquid under study to a height of 63 cm, an aspect ratio of 10 with respect to its hydraulic diameter of 6.3 cm. Bi-distilled water is the baseline for comparison and the base for preparing the ionic liquid mixtures, all of which are studied. Compressed air is regulated by a pressure reducer and metered by two rotameters (0–500 and 0–1000 nl/h, ±2% full scale), which set the superficial gas velocity. It enters a gas chamber at the base and is distributed through one of three interchangeable perforated plates with a triangular hole layout: Ø0.5 mm (97 holes), Ø1.0 mm (97 holes) and Ø1.5 mm (43 holes).
Continuous phase. Liquid velocity fields are measured with Particle Shadow Velocimetry (PSV). Volumetric LED backlighting and a shallow depth of field give sharp tracer-particle shadows without the lateral bubble shadows and light scattering that limit conventional PIV in bubbly flows. From the velocity fields we derive vorticity, strain and turbulence parameters. Images are recorded with a Phantom Miro C321 high-speed camera.
Dispersed phase. AI-based detection identifies individual bubbles even when their projections overlap, giving bubble size distributions and shapes. A deep-learning, graph-based tracker follows the bubbles through occlusions over long time spans, giving bubble velocities and trajectories.
Local and global measurements. Optical Doppler probes on the column give local gas holdup, bubble size distribution and bubble velocity. Pressure transducers give the global gas holdup, which, analysed within the flow-regime framework developed by Besagni (2021), is used to identify flow regimes and their transitions.
Computing. The image-analysis pipeline of the experimental data runs on an NVIDIA H200 GPU, which turns the recordings into bubble statistics for the whole swarm.
Measurement set-up
